PSLE Math 2023 Paper 2 Question 6
The answers below are from our Ten-Year-Series Programme, where our Principal Tutors will be covering the past 10 years of PSLE Math Papers (2014-2023). If you found this helpful and would like detailed video explanations to further aid your understanding, we encourage you to register for our Ten-Year-Series Programme.
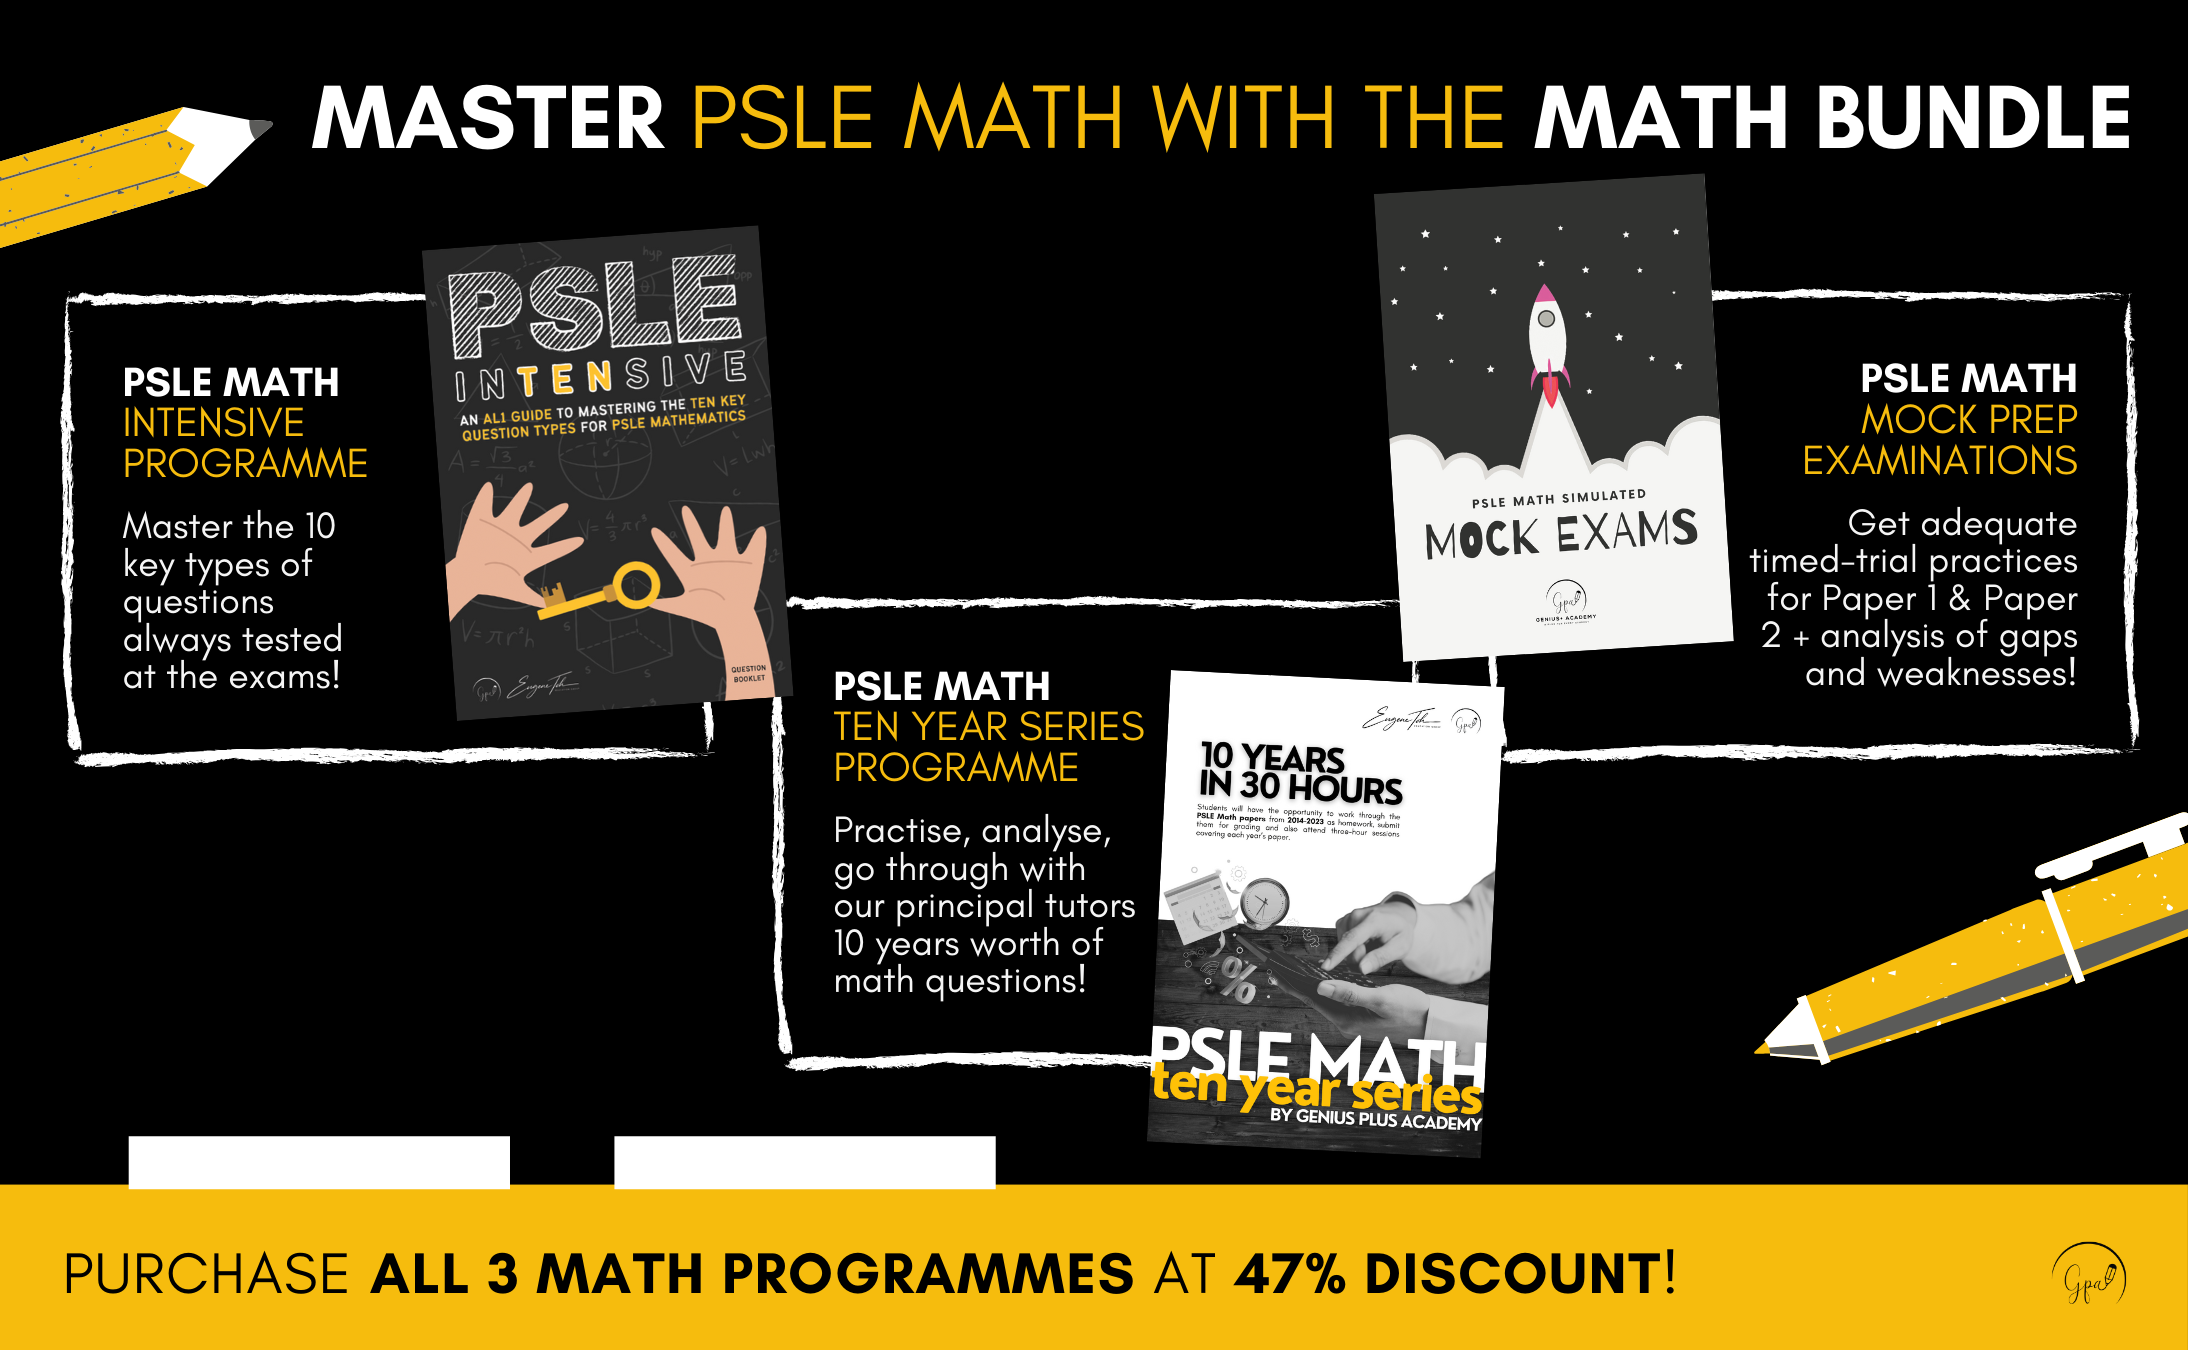
The Ten-Year-Series Programme is a part of our Math Bundle, which includes:
1. Ten-Year-Series Programme
2. Math Intensive Camp
3. Mock Exams
The majority of our P6 Students will register for our Last Lap Programme, which includes our Signature Math Programme and the Math Bundle.
To get answers to PSLE Math Paper 1, join our Telegram Channel.
(Pie Chart & Bar Graph Question)
PSLE Math 2023 Paper 2 Question 6
Based on the bar graph,
least most
Art < Guitar < Chess < Dance
Based on the pie chart,
least most
W < X < Z < Y
So, this means that Y represents Dance.
40% → 60
100% → 6040 x 100 = 150


